
Nairobi (Coinchapter.com) SHIB price has rebounded 10% in the last 24 hours, triggering speculation about a potential explosive rally. Despite its recent recovery, SHIB still faces a daunting 549% surge requirement to eliminate another zero from its price. With key technical indicators flashing buy signals and whale activity ramping up, could SHIB be on the verge of a major breakout?
Whales Pounce as Shiba Inu Hits Two-Year MVRV Low
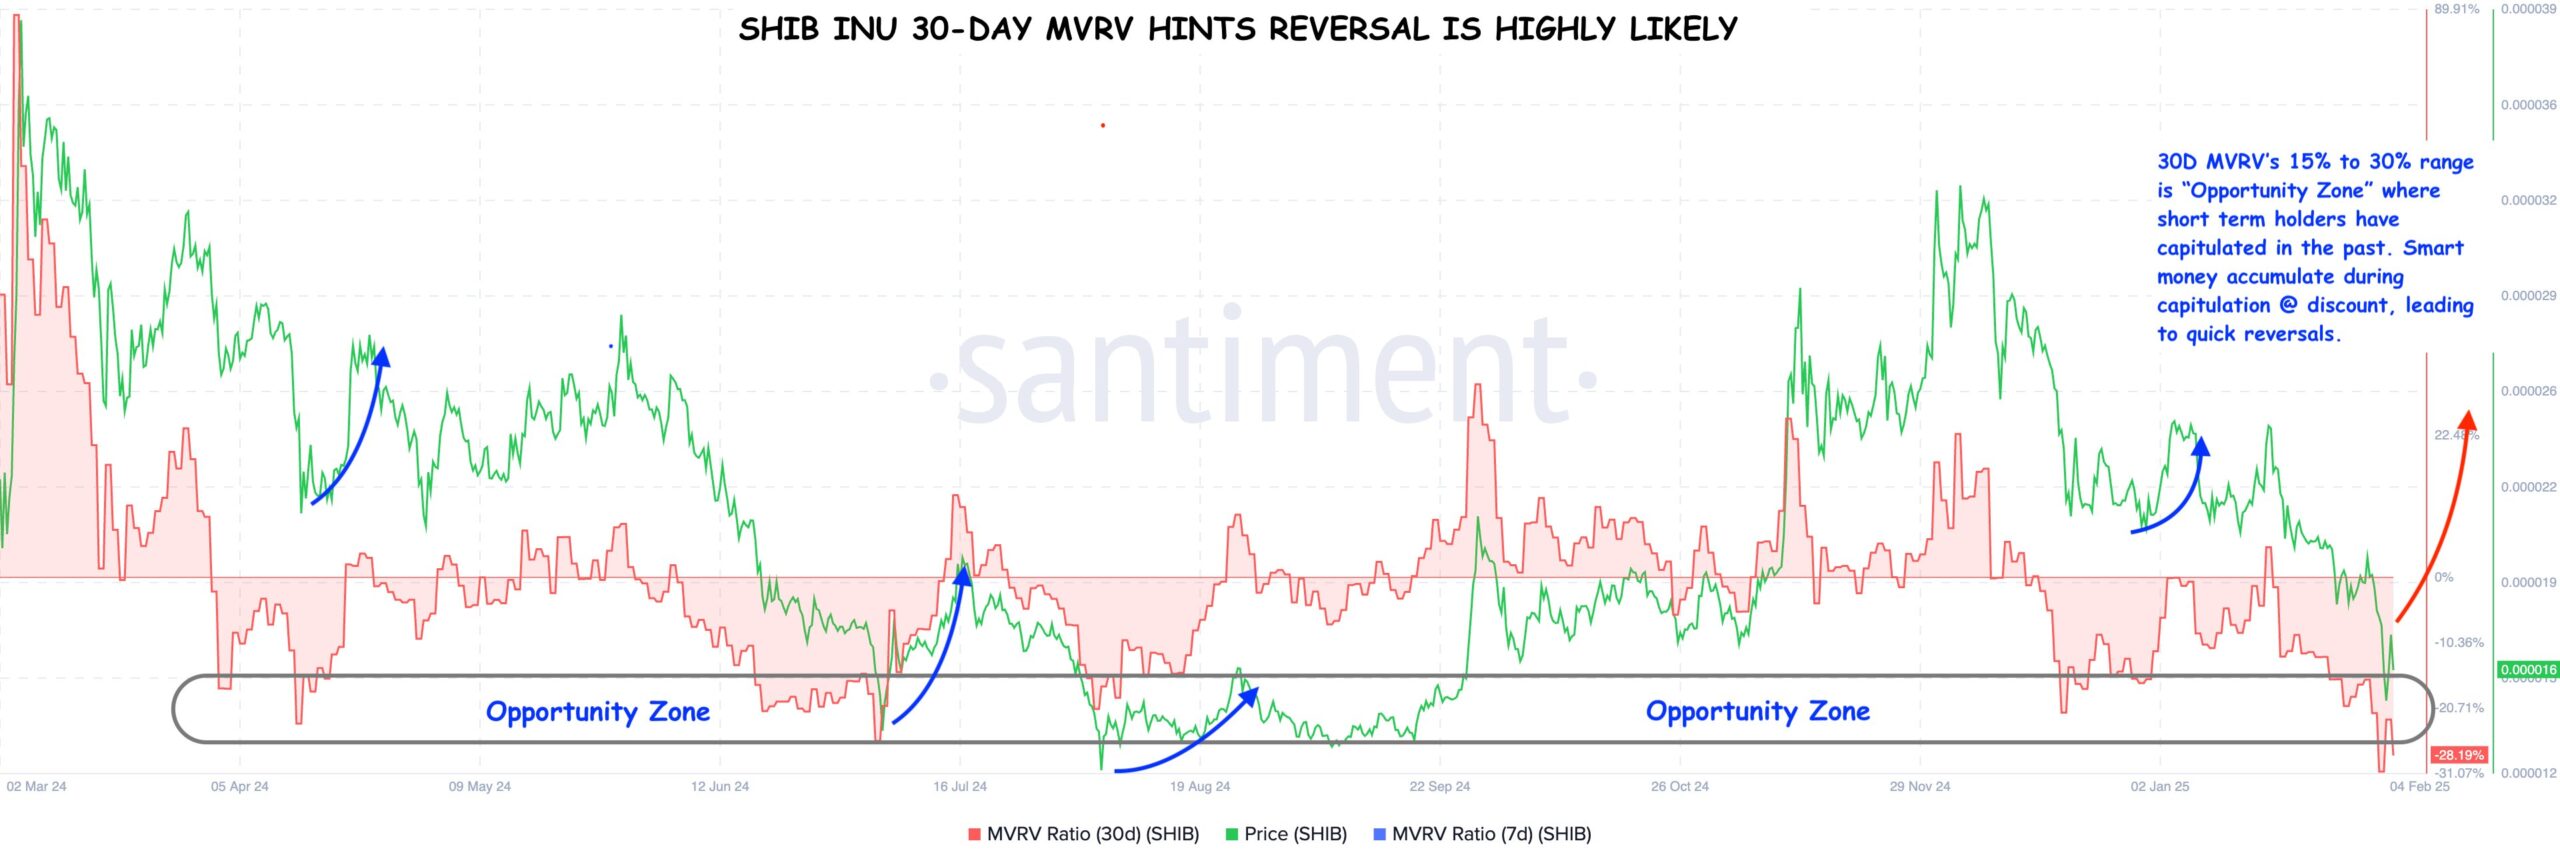
Shiba Inu (SHIB) is flashing potential recovery signals after a brutal sell-off. The meme coin’s 30-day Market Value to Realized Value (MVRV) ratio plummeted to -30.76%, a level last seen in May 2022. Historically, such deep negative readings have marked major price bottoms, triggering double-digit rebounds.
SHIB 30-Day MVRV signals potential reversal ahead. Source: X
Large holders appear to be paying attention. Data from IntoTheBlock reveals a 553% surge in whale inflows, jumping from 1.27 trillion SHIB on Feb. 2 to 6.51 trillion SHIB on Feb. 3. This suggests that deep-pocketed investors might be accumulating SHIB at discounted prices.
Large Holders Inflow. Source: IntoTheBlock
The metric indicates that most short-term holders are at heavy losses, placing the market in the “Opportunity Zone.” Past occurrences of MVRV reaching this level have led to sharp recoveries, but whether history repeats remains uncertain.
SHIB Must Overcome Key Hurdles to Rally 549%
Despite a 10% bounce, Shiba Inu (SHIB) faces stiff resistance levels that could limit its upside. The token must surge 549% to erase another zero and hit $0.0001, but technical indicators suggest that achieving such a rally will not be easy.
Shiba Inu 1-day price chart. Source: TradingViewThe Fibonacci retracement levels on the daily chart highlight two key resistance zones at $0.00001957 (0.618 Fib) and $0.00002058 (0.5 Fib). These levels previously acted as support, but with SHIB trading below them, they have now turned into resistance. For SHIB to sustain an uptrend, it must reclaim these levels with strong buying pressure.
SHIB’s Relative Strength Index (RSI) sits at 32.94, near oversold conditions. Typically, RSI levels below 30 indicate a potential reversal, but the current low trading volume of 875 million suggests weak demand, making an immediate breakout unlikely. The Directional Movement Index (DMI) shows a bearish trend, with the red -DI line (31.47) above the blue +DI line (8.68), confirming sellers remain in control.
Additionally, the 1.618 Fib extension at $0.00001096 presents a key long-term support level. If SHIB fails to hold its current range, it could retest this zone before any meaningful rebound.
To regain bullish momentum, SHIB must clear $0.00002 and sustain trading above it. Without strong volume and renewed buying interest, the current bounce could turn into another failed breakout attempt.
The post Can SHIB Soar 549% to Erase Another Zero? appeared first on Coinchapter.


